The BCG Growth-Share Matrix
The BCG Growth-Share Matrix is a portfolio-planning model developed by Bruce Henderson of the Boston Consulting Group in the early 1970s. It is based on the product life-cycle theory that can be used to determine what priorities should be given in the product portfolio of a business unit. To ensure long-term value creation, a company should have a portfolio of products that contains both high-growth products in need of cash inputs and low-growth products that generate a lot of cash.
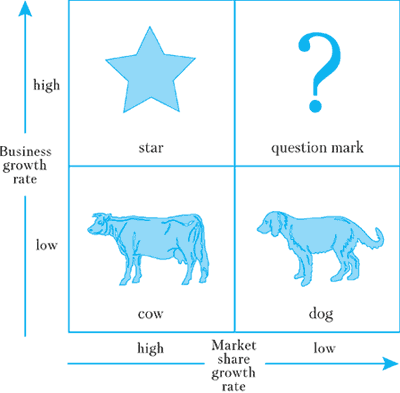
The matrix proceeds from the assumption that a company’s business units can be classified into four categories based on combinations of market growth and market share relative to the largest competitor, hence the name «growth-share». Market growth serves as a proxy for industry attractiveness, and relative market share serves as a proxy for competitive advantage. The growth-share matrix maps the business units’ positions within these two important determinants of profitability.
This framework assumes that an increase in relative market share will result in an increase in the generation of cash. This assumption often is true because of the experience curve; increased relative market share implies that the firm is moving forward on the experience curve relative to its competitors, thus developing a cost advantage. A second assumption is that a growing market requires investment in assets to increase capacity and therefore results in the consumption of cash. Thus the position of a business on the growth-share matrix provides an indication of its cash generation and its cash consumption.
The cash required by rapidly growing business units could be obtained from the firm’s other business units that were at a more mature stage and generating significant cash. By investing to become the market share leader in a rapidly growing market, the business unit could move along the experience curve and develop a cost advantage. From this reasoning, the BCG Growth-Share Matrix was born.
The four categories of the matrix are:
Dogs. Dogs have a low market share and a low growth rate and thus neither generate nor consume a large amount of cash. However, dogs are cash traps because of the money tied up in a business that has little potential. Such businesses are candidates for divestiture.
Question Marks. Question Marks are growing rapidly and thus consume large amounts of cash, but because they have low market shares they do not generate much cash. A question mark has the potential to gain market share and become a star, and eventually a cash cow when the market growth slows. If the question mark does not succeed in becoming the market leader, then after years of cash consumption it will degenerate into a dog when the market growth declines. Question marks must be analyzed carefully in order to determine whether they are worth the investment required to grow market share.
Stars. Stars generate large amounts of cash because of their strong relative market share, but also consume large amounts of cash because of their high growth rates; therefore the cash in each direction approximately nets out. If a star can maintain its large market share, it will become a cash cow when the market growth rate declines. The portfolio of a diversified company always should have stars that will become the next cash cows and ensure future cash generation.
Cash Cows. As leaders in a mature market, cash cows exhibit a return on assets that is greater than the market growth rate, and thus generate more cash than they consume. Such business units should be «milked», extracting the profits and investing as little cash as possible. Cash cows provide the cash required to turn question marks into market leaders, to cover the administrative costs of the company, to fund R&D, to service the corporate debt, and to pay dividends to shareholders. Because the cash cow generates a relatively stable cash flow, its value can be accurately determined by calculating the present value of its cash stream using a discounted cash flow analysis.
Under the growth-share matrix model, as an industry matures and its growth rate declines, a business unit will become either a cash cow or a dog, determined solely by whether it had become the market leader during the period of high growth.
While originally developed as a model for resource allocation among the various business units in a corporation, the growth-share matrix also can be used for resource allocation among products within a single business unit.
The BCG matrix can help understand a frequently made strategic mistake: having a one-size-fits-all approach to strategy such as a generic growth target or a generic return on capital for the entire corporation.
In such a scenario:
Cash Cows will beat their profit target easily; their managers have an easy job and are often praised anyhow.
Dogs fight an impossible battle and, even worse, investments are made now and then in hopeless attempts to «turn the business around».
As a result, Question Marks and Stars get mediocre investment funds. In this way they are unable to ever become cash cows and earn money.
Более 800 000 книг и аудиокниг! 📚
Получи 2 месяца Литрес Подписки в подарок и наслаждайся неограниченным чтением
ПОЛУЧИТЬ ПОДАРОКДанный текст является ознакомительным фрагментом.